For the 50th anniversary of Earth Day, I worked with home energy monitor startup Sense to illustrate how the typical new home in the U.S. today has evolved since the first Earth Day in 1970, and where that trend might take us another 50 years in the future.
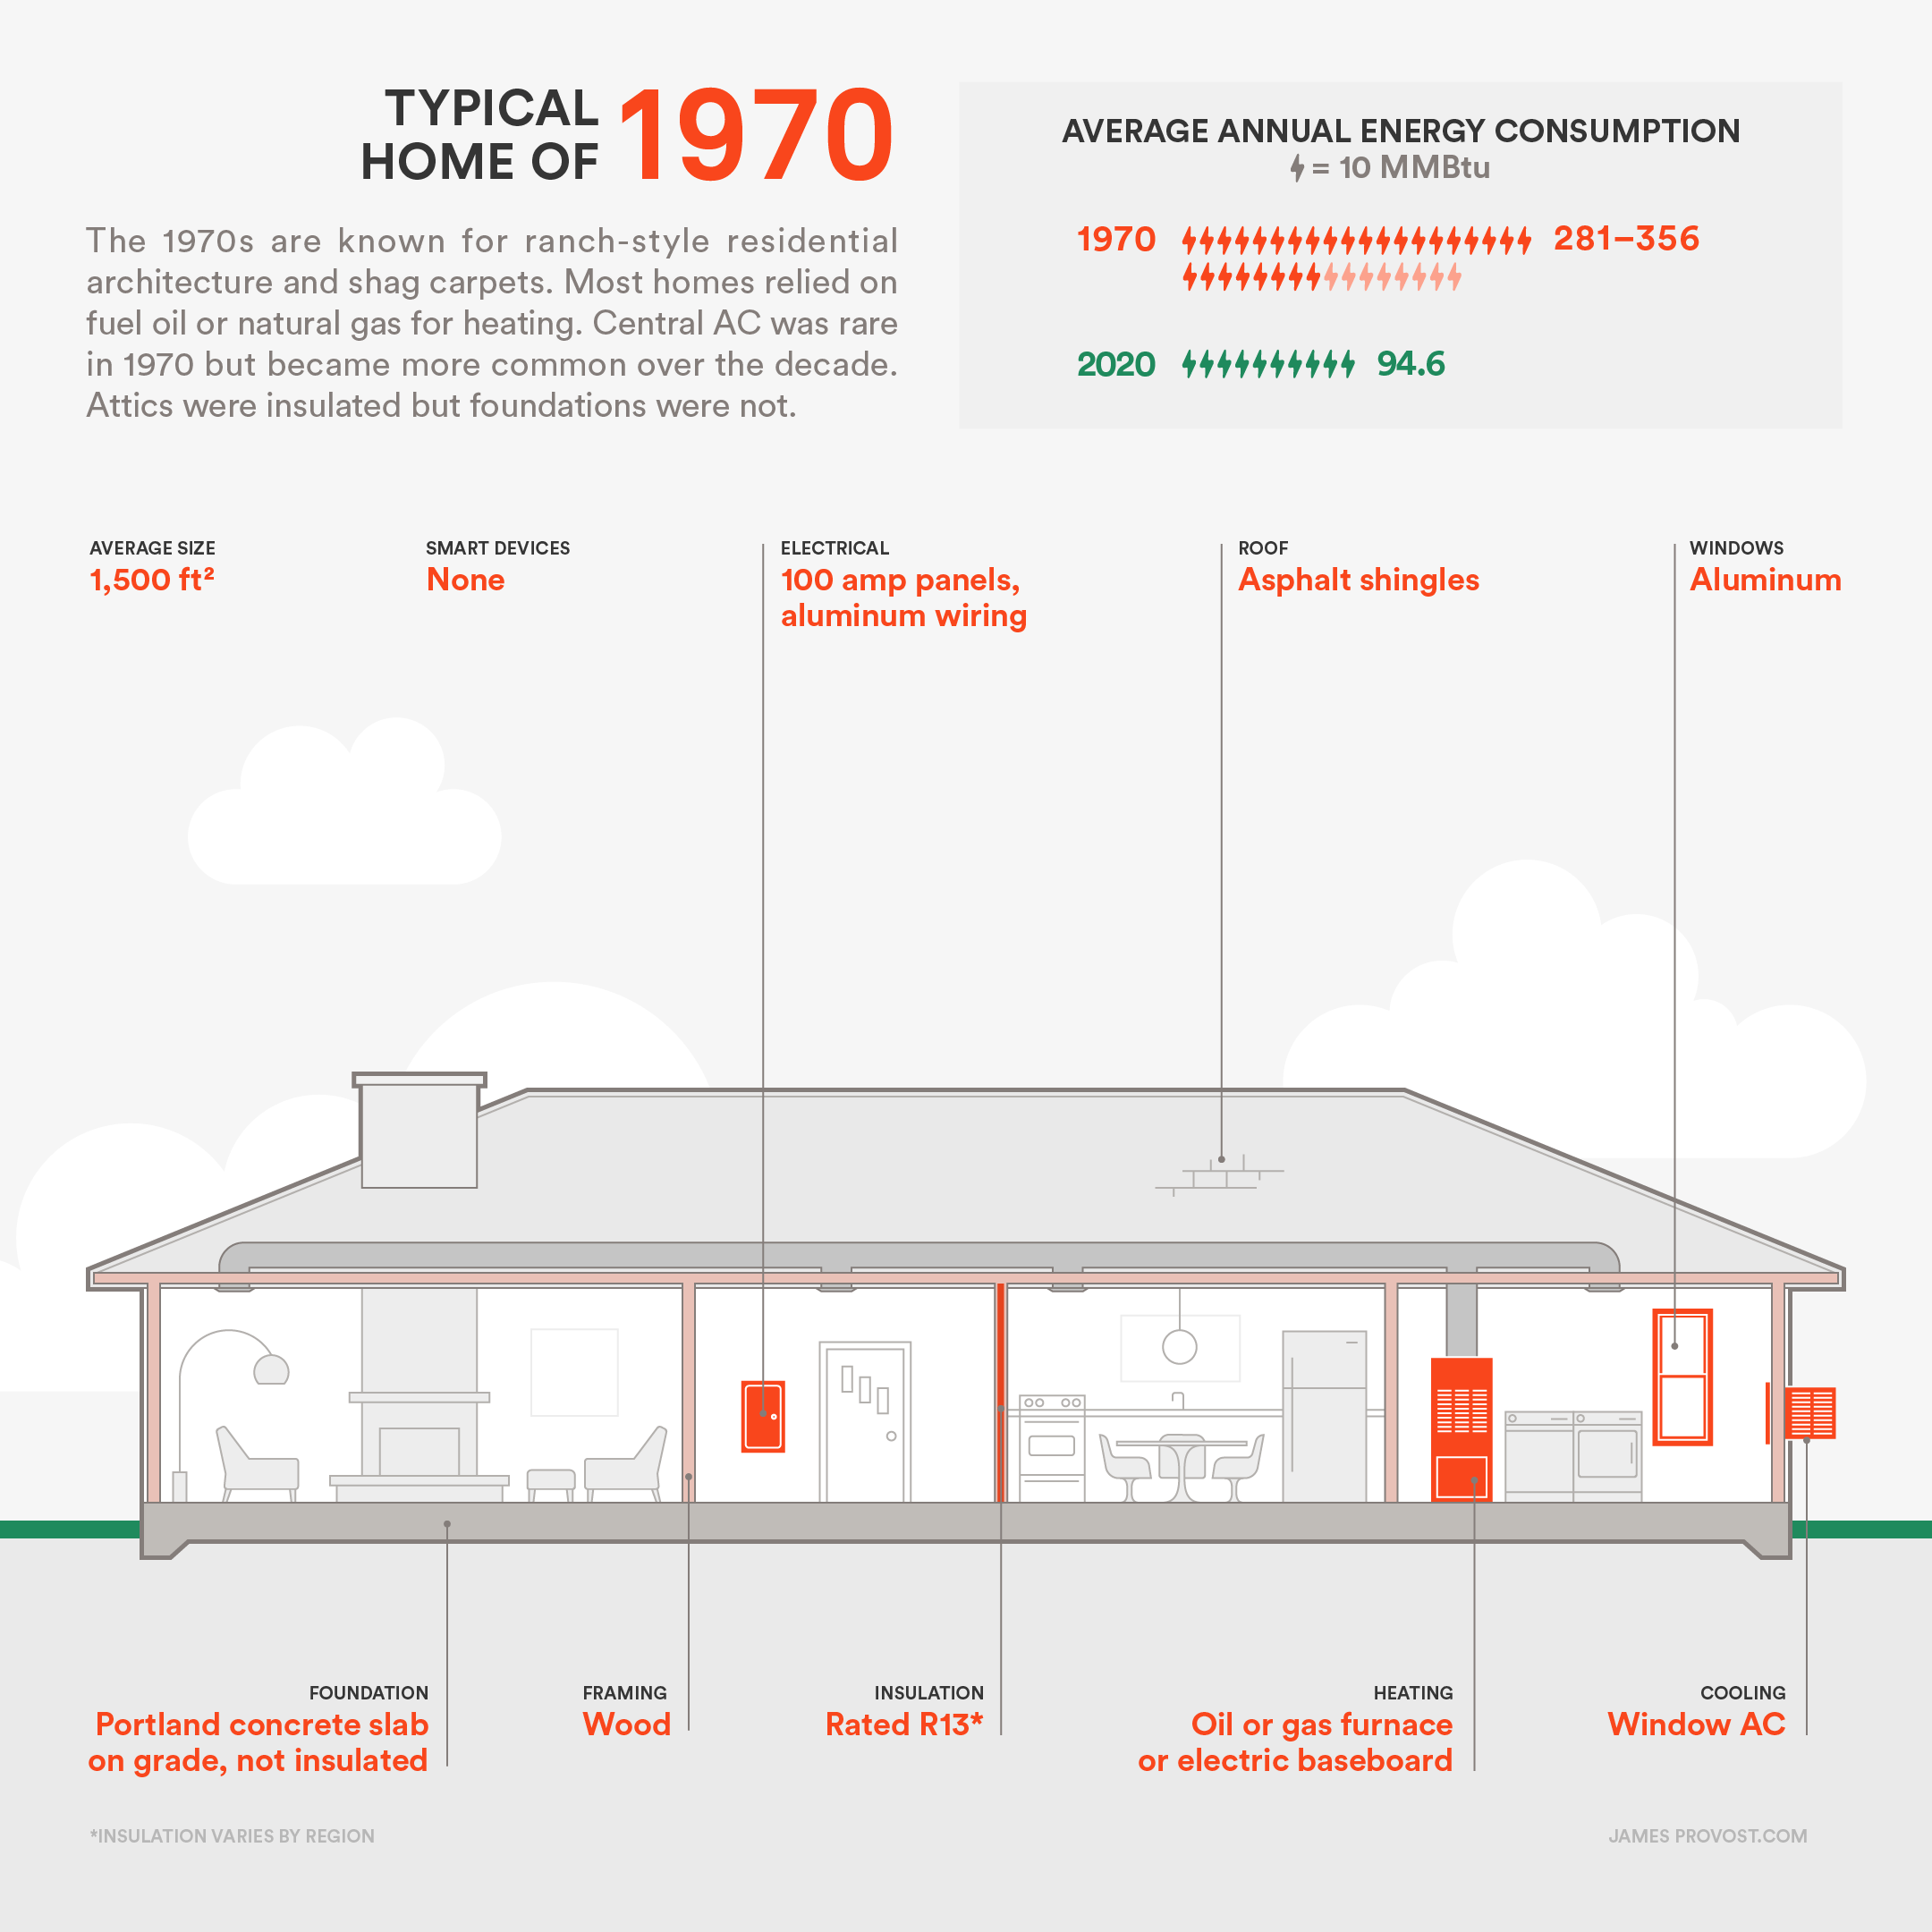
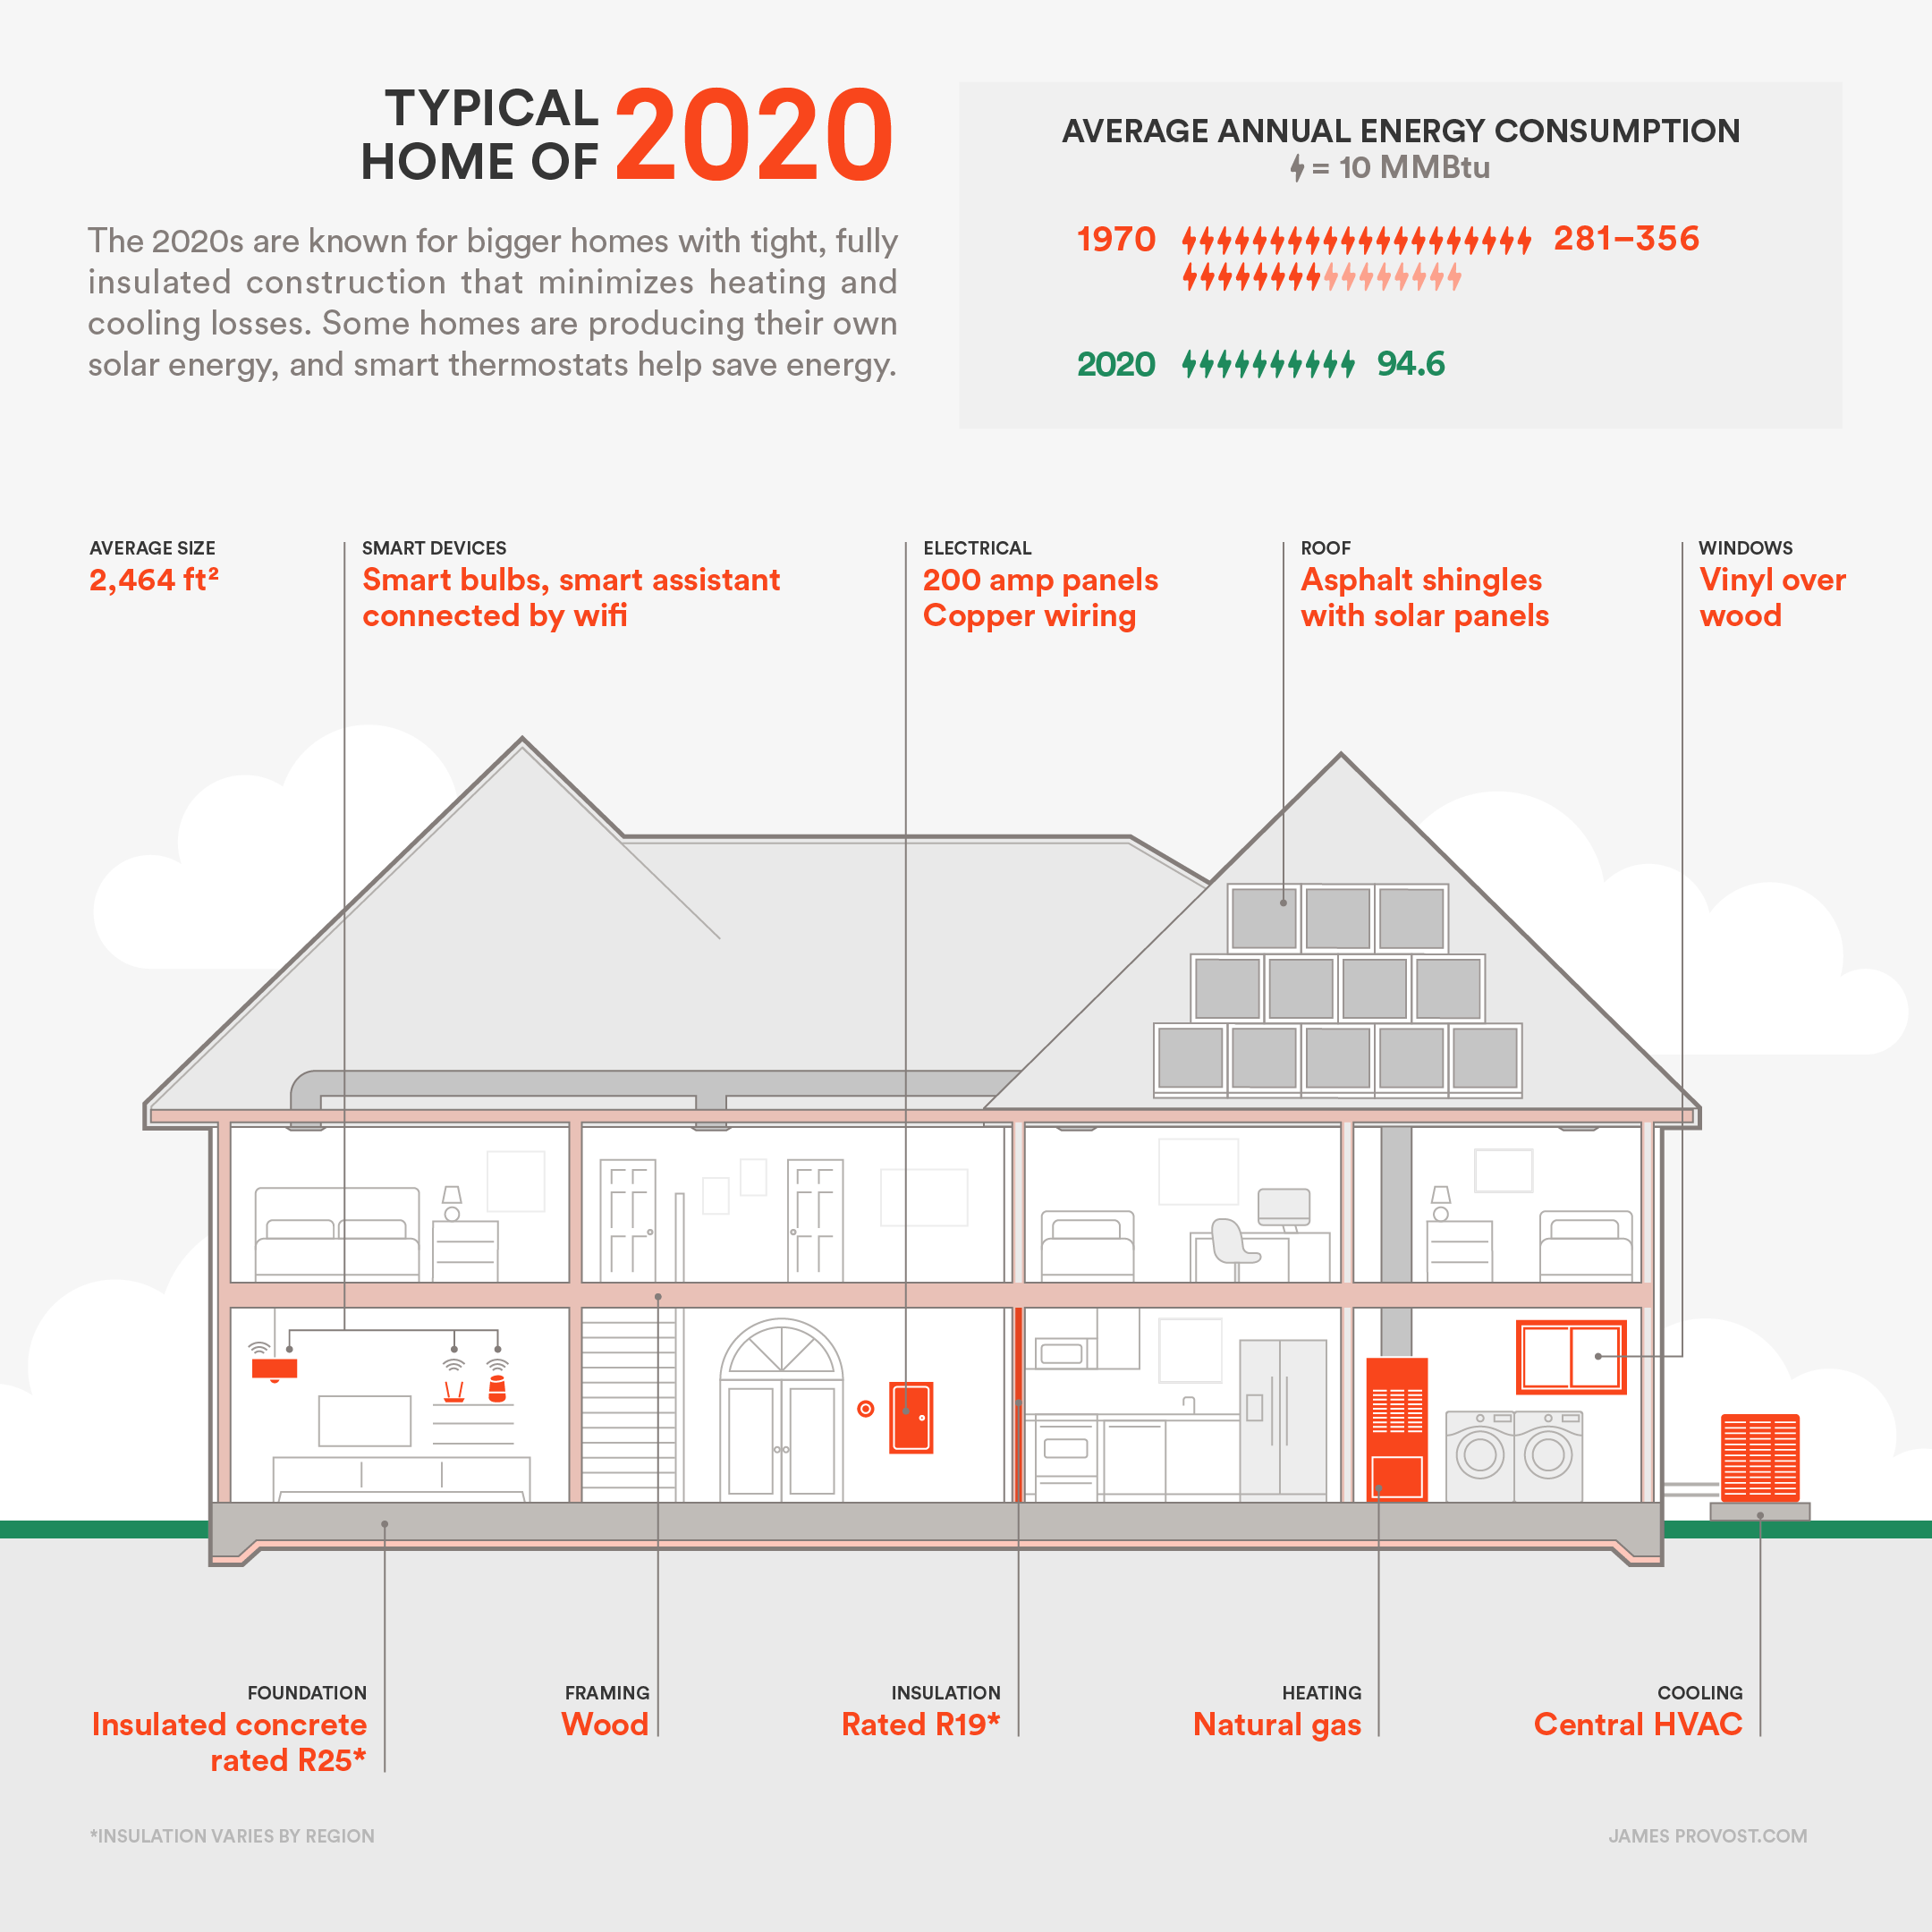
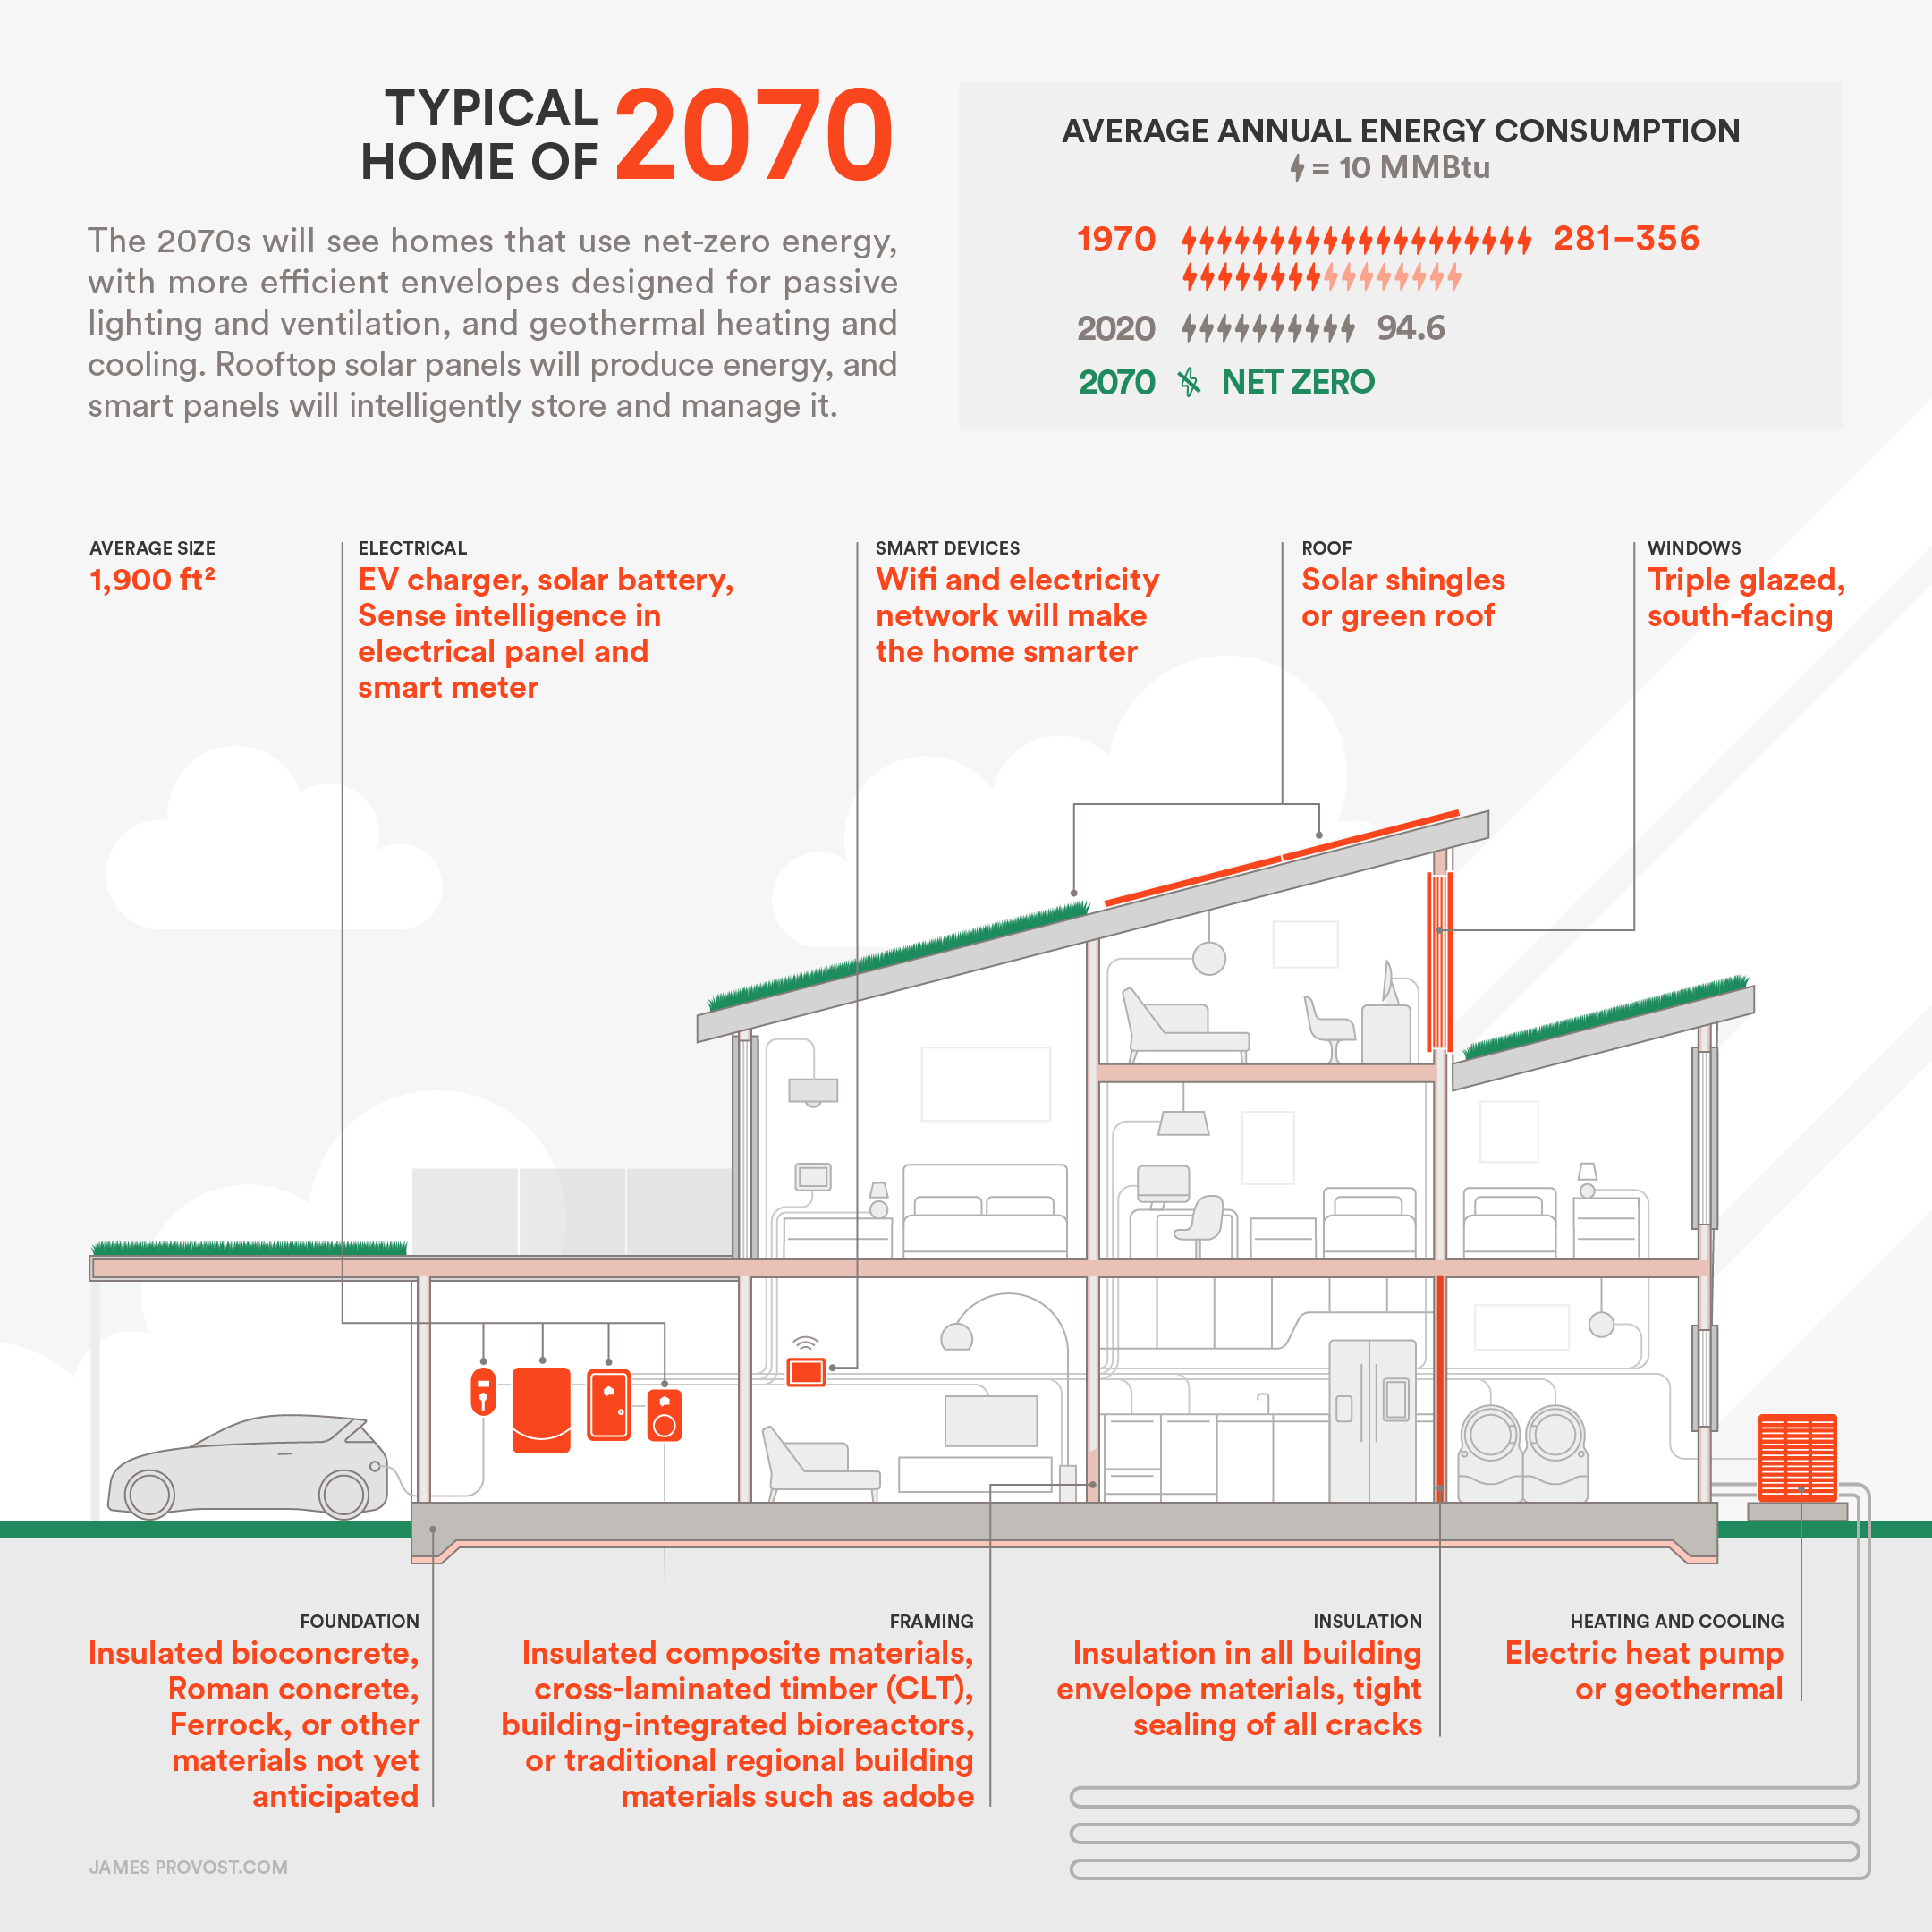
These infographics expand on previous work I’ve done with Sense on their user installation guide illustrations. Like those, these condense a wealth of complex information into an accessible, visually engaging medium. But here, illustration is used to place the brand in the wider context of energy and sustainability. It speaks to their customer’s concerns and interests, and increases engagement with the brand.
The brand also informs the style of the illustrations, leveraging its bold colour palette, clean typography, and its emphasis on organization and simplifying complexity. Branded illustrations can be a powerful tool for communicating a company’s values, principals, and identity.
James, we all loved the illustrations […] I hope we get another chance to work together soon on upcoming content. I really enjoyed it and thought the illustrations were excellent.
These illustrations were used on the Sense blog and their social media channels. Thanks to Rhoda and Carol for their trust and guidance on this project!